Appendix
Transitioning to a Circular System for Plastics: Assessing Molecular Recycling Technologies in the United States and Canada
The following content is a supplemental resource that accompanies Closed Loop Partners’ report Transitioning to a Circular System for Plastics: Assessing Molecular Recycling Technologies in the United States and Canada.
Molecular recycling is a diverse sector that encompasses dozens of technologies that use solvents, heat, enzymes, and even sound waves to purify or break down plastic waste to create polymers, monomers, oligomers or hydrocarbon products. The sector is made up of purification, depolymerization, and conversion technologies that can process a wide range of plastic waste including packaging, textiles, healthcare plastics, and wind turbine blades, addressing overlooked plastics that today do not have end-of-use recovery solutions. The term “molecular recycling” is synonymous with the term “advanced recycling” and includes more commonly known “chemical recycling” technology processes like pyrolysis. However, the term “molecular recycling” is inclusive of other types of technology processes that do not leverage chemicals and instead use enzymes, soundwaves and other technology platforms that transform plastics.
1.0: How the Advanced Recycling Technology Companies were Selected to Participate
Selection of Molecular Recycling Companies for Our Study
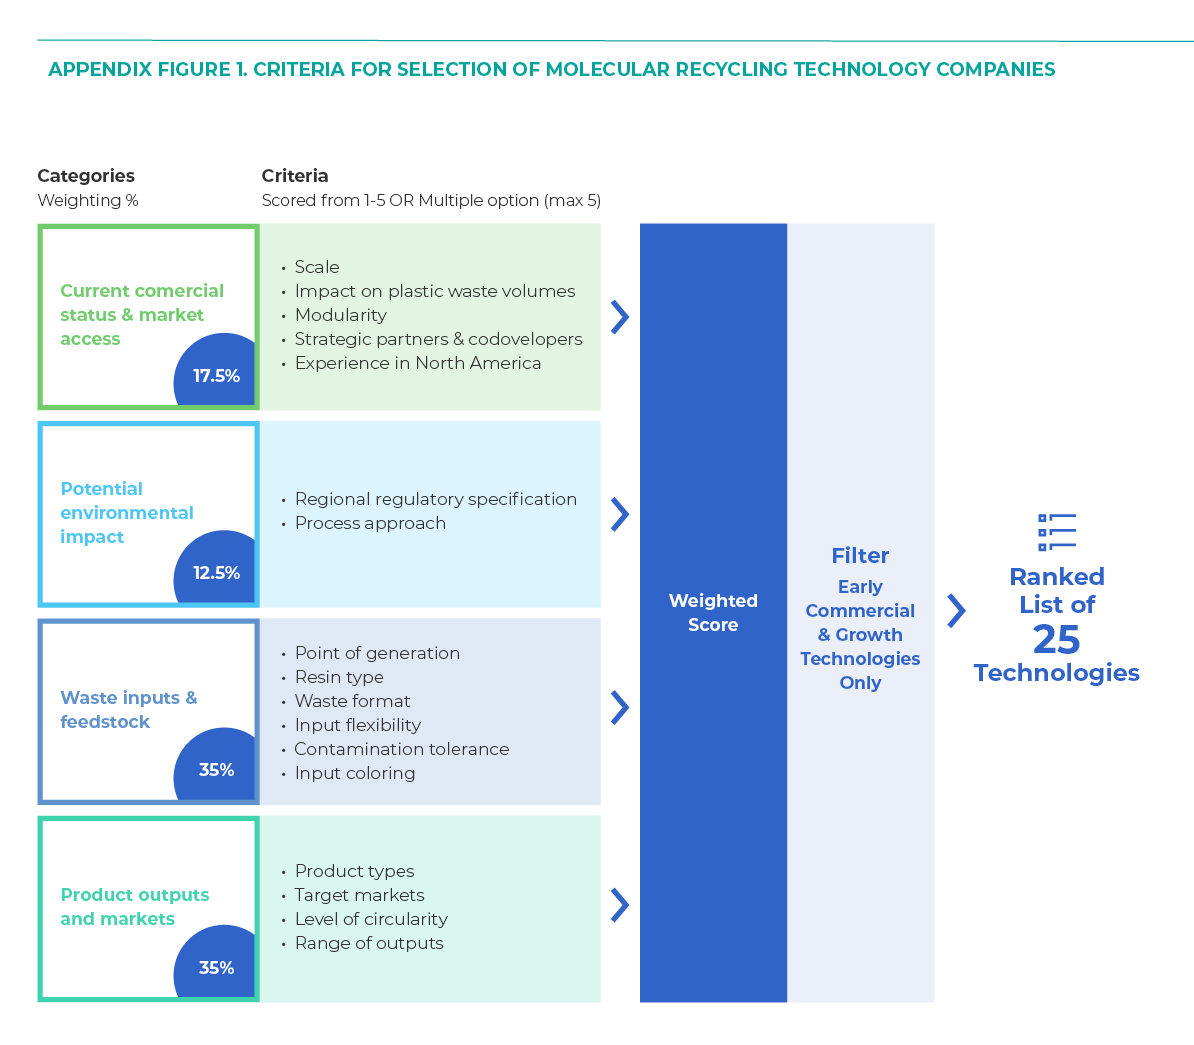
Nine molecular recycling companies were selected by Closed Loop Partners from over 85 molecular recycling companies screened during February and March 2020 using a multi-stage screening approach. The first step in the screening process took a quantitative approach to score each technology company across seventeen different criteria (Appendix Figure 1). Early commercial and growth stage companies were prioritized so that our teams were, as much as possible, analyzing real-world operational data rather than projected figures. To appropriately aggregate and anonymize data, Closed Loop Partners set out to evaluate at least two technology companies from each of the three technology categories and ensure that the portfolio of technology companies addressed a diversity of feedstock (i.e. textiles to mixed plastic). To achieve that goal, a subset of the “top 25 ranked” technology companies were invited to join the project.
The final nine molecular recycling companies and the types of technology processes selected for the investor roadmap was shaped by:
– The information available to Closed Loop Partners through its Advancing Circular Systems for Plastics Initiative and our previous molecular recycling landscape report which profiles 61 companies around the world.
– The willingness of molecular recycling technology companies to participate and share confidential financial and technology process data with our team and technical analysts;
– Availability of, and access to, sufficient qualitative and quantitative data for modelling and assessment (i.e. partnering with later-stage companies to work with actuals vs projected data)
– Desire to review a diverse set of technology platforms, including biological processes and processes that address textile feedstock.
Appendix Figure 1. Criteria for Selection of Molecular Recycling Technology Companies
The companies chosen to participate in our study include:
Purification Companies: APK AG and PureCycle Technologies
Depolymerization Companies: Carbios, gr3n, GreenMantra, and JEPLAN,
Conversion Companies: Brightmark, Enerkem, and Plastic Energy
These nine companies participated in the deep-dive technology due diligence and lifecycle and human health analysis are a part of Closed Loop Partners’ Advanced Recycling Innovator Program (ARIP), a platform, which was developed to execute this project and mutually exchange confidential data and lessons from our analysis between individual molecular recycling technology companies and Closed Loop Partners.
Our team also collected financial data from three additional technology companies to evaluate the financial viability of smaller, modular systems. These companies are not part of the Advanced Recycling Innovator Program and include: Renew One, Recycling Technologies, and Synova. These companies’ profiles as well as the profiles of over 70 other molecular recycling companies around the world can be found in Closed Loop Partners Global Directory of Molecular Recycling Companies which has been published as a supplement to the main report.
2.0: Financial and Economic Analysis Methodology
Methodology
The financial assessment has been based on the input information provided and verified by the individual technology companies. The financial analysis uses Capital and Operating Expenditure (CAPEX and OPEX), feedstock payments and tipping fees, company output prices, as well as information on market of main outputs and by-products as well as residue disposal costs.
A financial model has been developed to appraise each of the technologies using a consistent approach and a simple set of criteria:
– Development costs, although captured during the project, are not included in the financial analysis as these may represent costs that have the potential to be split across multiple investment cycles and therefore not representative for a single facility or project.
– Capital expenditure to develop each facility is assumed to be a lump sum cost in year 0 of each facilities development and therefore additional costs of capital (which could vary for each development and geography) are not included within the analysis;
– Facility lifetimes range between 20 – 30 years as provided by technology suppliers and define the financial models’ scope for each technology. Our team has taken the liberty to reduce plant life time of more than 30 years to ensure comparability;
– Annual operational costs and revenues from the operational facility (as provided by the supplier or derived from market rates) are inflated providing a cash flow waterfall from year 1 for the operational lifetime of the facility;
– Discount rates of between 10 and 20% are applied in the calculation of NPV for each facility to identify viability at different risk positions and to investigate viability for different types of investors
The financial model therefore provides a consistent but simplified appraisal of each technology’s commercial viability, providing outputs of IRR, NPV and payback periods that are indicative of how each technology could be expected to perform given the current data available gathered during the progress of this project.
A note about our IRR and payback period results:
– IRR’s ranges illustrated are representative of individual financial models developed for each technology calculated based on the upfront capital costs and year on year forecast cash flows. Ranges therefore reflect lowest and highest returns by technology category.
– Payback periods have been calculated as the point at which positive returns can be returned. This is calculated based on all CapEx costs being up front and future costs and benefits discounted at rates of 10% (baseline) and 20%. Payback periods presented are the average of technologies offering a positive payback for each at each price point. As such ticks within bars represent the number of facilities included within each average payback period calculation.
These output metrics have been sensitivity tested at three different output prices:
– Current Market Prices 2021 – these reflect the latest market pricing for output products as of August 2021
– 2019 Market Prices – these reflect a market low from previous analysis
– Company Assumed Output Prices – these reflect price points provided to us by technology providers and what are anticipated by them within their own business models
Throughout the report various figures are used to illustrate the outputs of the financial analysis. These are explained in more detail below.
2.1: Explanation of Figure 11: Expected Internal Rate of Return on Investment of Molecular Recycling Across Three Market Scenarios
These IRR’s ranges illustrated are representative of individual financial models developed for each technology. A consistent approach to financial modelling has been used consisting of:
– A consistent system boundary including only the costs and revenues relating the individual facility and its operational lifespan
– All Capex and OpEx information has been provided by technology companies
– Inflators on all costs and prices has been assumed to be the same for future years
– Variation in returns have been tested utilising a range of output prices reflecting the sensitivity of technologies at 2019 average market prices, 2021 average market prices, and output prices assumed by the technology companies where they were shared for the purpose of the analysis.
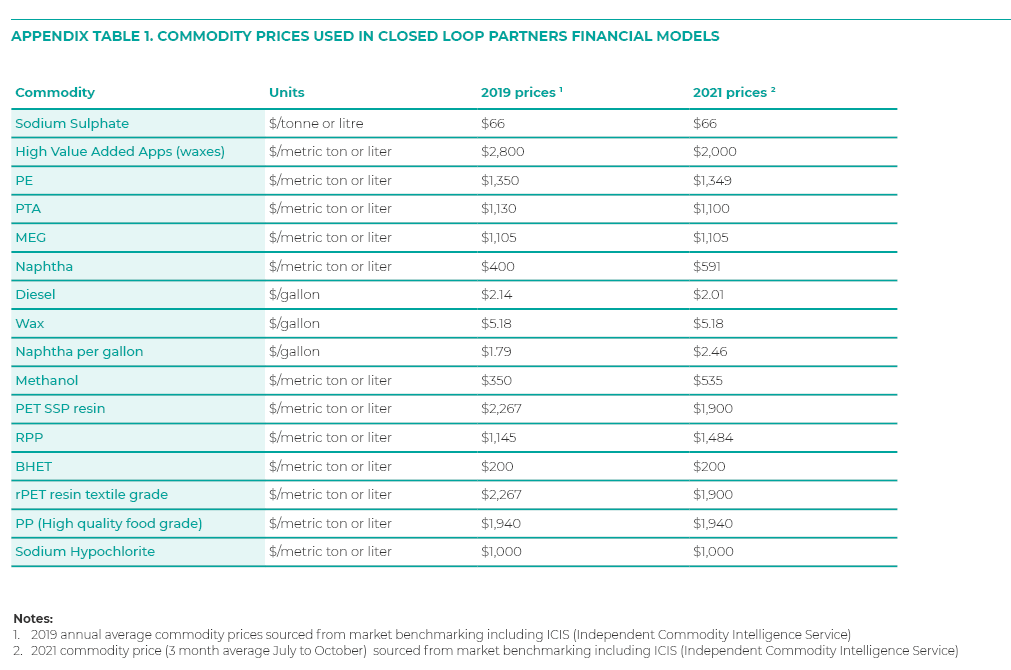
– Commodity prices used for output products are based on the values in Appendix Table 1.
Appendix Table 1. Commodity Prices Used in Closed Loop Partners Financial Models
2.2: Explanation of Figure 12: Molecular Recycling Output Pricing Required to Reach 10% or 20% IRR Compared to 2021 Market Prices
Requirements for premium pricing have been tested through the technology financial models and aggregated by category. Sensitivity testing has been undertaken to identify the variation (i.e. uplift or reduction) in output prices that technology groupings could require to reach 10% and 20% return thresholds. In some technologies, this demonstrates resilience against price reductions, whilst in others it demonstrates a requirement for premium prices to achieve returns of 10% or 20%. Baseline price points used in our analysis are reflective of 2021 output prices which are detailed in Appendix Table 1 above.
2.3: Explanation of Figure 13: Range and Average of Net Value Creation across the Three Molecular Recycling Technology Categories
To calculate the cumulative added value by each molecular recycling technology, our teams used a value-chain view to understand the costs embedded in the supply chain, from waste generation through sorting to output generation. Our team considers collection costs, sorting costs, and treatment costs as embedded value in recycling activities, and compares this to the value generated by returning products to market in the form of monomers, polymers, fuels or other products. Thus, value added is estimated as the value placed on the output product by end markets minus any costs embedded in the processes to produce those products.
In undertaking this analysis some costs have been assumed within each value chain:
– Collection costs – $45 – $75 per metric ton
– Material aggregation costs – $9-15 per metric ton
– Material Recovery Facility (MRF) sorting costs – $35 – 65 per metric ton
– Shredding and flaking – $35-65 per metric ton
– Mechanical Recycling (i.e. cleaning, extrusion and pelletisation) – $300 – 700 per metric ton
2.4: Explanation of Figure 15: Two Scenarios to Reach a 30% Plastics Packaging Recycling Rate
Using our defined value chain modelling approach, Figure 15 represents aggregate outputs for two scenarios to reach 30% recycling rate across all packaging forms presented in the United States and Canada. These two scenarios consist of:
Scenario 1: Conversion Only
This explores the impact and value added performance of achieving the uplift in recycling performance by diverting additional waste plastics to conversion technologies only.
Scenario 2: Mixed Technologies Approach
This explores the impact and value added performance of achieving the uplift in recycling performance by diverting waste plastics to a mixture of molecular recycling technologies depending on feedstock acceptability and ability of technologies to recycle plastics back to higher value products.
For each scenario key outputs are presented these can be explained as:
– Capital investment required – the capital investment $ required for the delivery of the molecular recycling technologies
– Value added – the direct value added from waste plastics being diverted down recycling streams calculated based on the final product value – embedded costs of the value chain to produce it.
– Net benefit – the value added plus avoided costs of the business as usual disposal of waste plastics to landfill
– Number of molecular recycling facilities required – the number of additional facilities (at average capacity by technology category) required to divert the additional plastic waste
In undertaking this analysis some costs have been assumed within each value chain:
– Collection costs – $45 – $75 per metric ton
– Material aggregation costs – $9-15 per metric ton
– MRF sorting costs – $35 – 65 per metric ton
– Shredding and flaking – $35-65 per metric ton
– Mechanical recycling – $300 – 700 per metric ton
2.5: Explanation of Figure 16: Additional Plastic Packaging Amount, Capacity and Capital Needed to Reach a 30% Recycling Target by 2030
Building on Figure 15, Figure 16 provides the required capacity and investment needs broken down by value chain step and gives indication of where investment is required across key stages of collection, sortation, Secondary reprocessing and molecular recycling. These figures are drawn from the value chain analysis in figure 15 which factors in mass flows through the system alongside CAPEX per metric ton and OPEX per metric ton requirements.
2.6: Explanation of Figures 27, 31, 35
These figures are designed to provide an overview of the types of operating business model for each category evaluating operating costs, operating revenues and indicative operating margins.
In these figures:
– Operational costs represent the average operating costs of a technology group divided by the average throughput tonnage per year. Throughput tonnage representative of the tonnage of waste into the advanced recycling process each year.
– Average revenue per metric ton represents the average revenue of technology groups divided by the average throughput tonnage per annum.
– Potential margin per metric ton simply representative of the difference between revenue per tonne – operating costs per tonne
– CapEx as a proportion of margin equals a simple calculation to divide average CapEx per metric ton by margin per metric ton
2.7: Explanation of Figures 28, 32, 36
A consistent approach to financial modeling has been used consisting of:
– A consistent system boundary has been assumed including only the costs and revenues relating the individual facility and its operational lifespan
– All CapEx and OpEx information has been provided by technology operators
– Inflators on all costs and prices has been assumed to be the same for future years
– Variation in returns have been tested utilizing a range of output prices reflecting the sensitivity of technologies at 2019 market prices, 2021 market prices, and output prices assumed by the technology providers
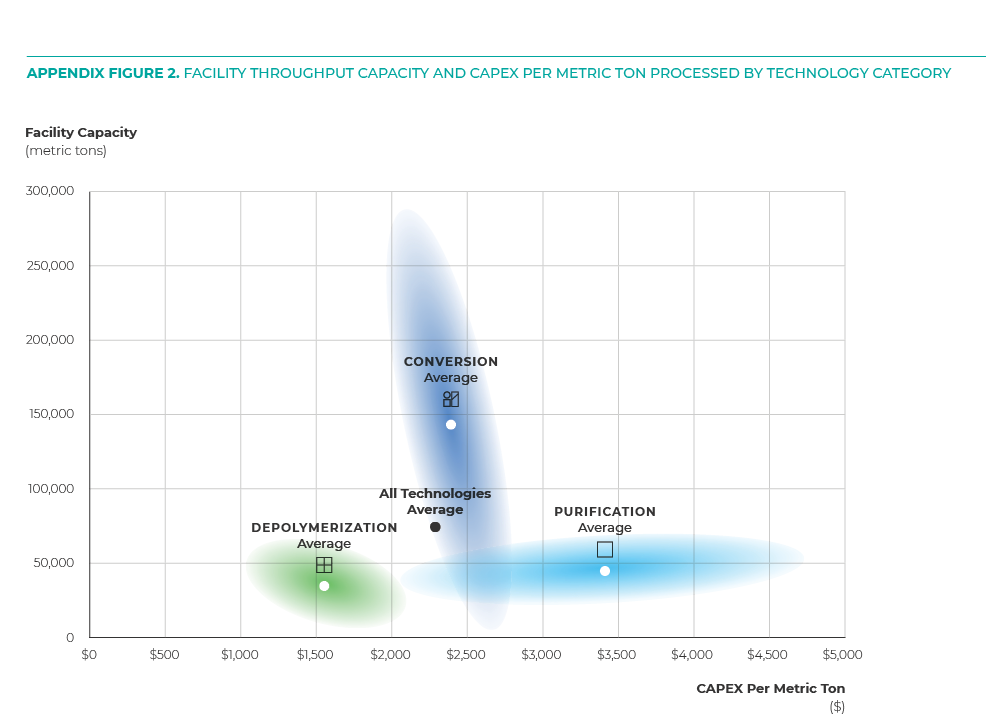
2.8: Capital Expenditure and Molecular Recycling Facility Throughput Capacity based on the Nine Technology Companies Evaluated
A simple plot of CapEx per metric ton against throughput capacity of facilities organized by technology groups in order to assess potential range in capital requirements of facilities at different scales.
Appendix Figure 2. Facility Throughput Capacity and CapEx per Metric Ton by Technology Category
3.0: Plastic Packaging Recycling in the United States and Canada
As part of our research, Closed Loop Partners set out to understand how much plastics in the system could be processed by molecular recycling technology technologies. Because there is limited data on the volumes, flows, and formats for the majority of plastics in our economy, we focused our analysis on plastics packaging. Appendix Table 2 summarizes plastic generation, current recycling, current recycling rate and tonnage required to reach a 30% recycling rate across resins and packaging formats.
Appendix Table 2. US and Canada: Plastic Packaging Generation, Recycling Rates, and Required Uplift to Reach 30% Recycling Rate
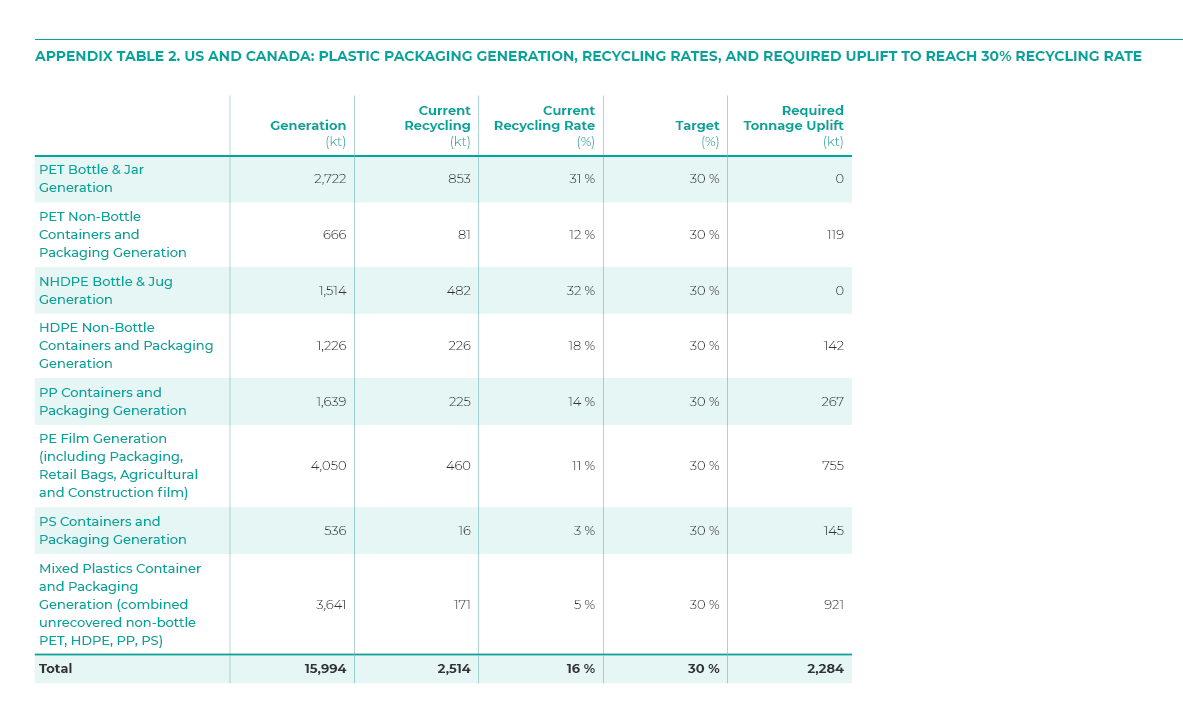
We found that 11.5 million metric tons of plastic packaging are sent to landfills every year, with only 18% of packaging produced being recaptured by the recycling system. Formats, applications and end-of-life markets for the different plastic resins are varied within the packaging sector alone, many requiring different recovery pathways, depending on the regional nuances of the existing recovery infrastructure and end-markets available for recycled materials.
Closed Loop Partners also developed the US and Canada Recycling Infrastructure and Plastic Waste Map which is an interactive map that breaks down the volumes of plastics by type and the flows by country, state and province and overlays it with information about the plastics recycling infrastructure in both countries. These maps are free to use and available on Closed Loop Partners’ website.
Explanation of Figure 14: 2019 Generation and Recycling Quantities across Packaging Resins and Additional Mass Recovery Required to Achieve 30% Recycling Target
Utilizing the cumulative added value by each individual technology as calculated in Figure 13, Figure 14 provides a technology grouping overview highlighting the range of potential cumulative added value from diverting plastics away from landfill and towards these technology groupings. Darken lines represent the average cumulative value added expected from each technology grouping.
4.0: Environmental Impact Analysis Scope and Methodology
Environmental Impact Analysis Research Scope and Where to Find the Results in the Main Report
Closed Loop Partners’ sought to answer the following questions through its environmental impact analysis:
– What are the environmental impacts of molecular recycling processes and how do those impacts compare to producing the same products through the virgin petrochemical supply chain?
– What are the system-level (i.e plastics supply chain) environmental impacts to produce plastic through distinct supply chains (i.e. purification, depolymerization, and conversion)? How do those system-level impacts compare to virgin plastic production?
– As renewable energy becomes a larger part of the electricity grid, how can we expect the impacts of these molecular recycling technologies to change over time?
– For plastic material that can be routed through mechanical recycling and multiple molecular recycling technologies, what is the optimal route from an environmental standpoint for the materials for which we have data?
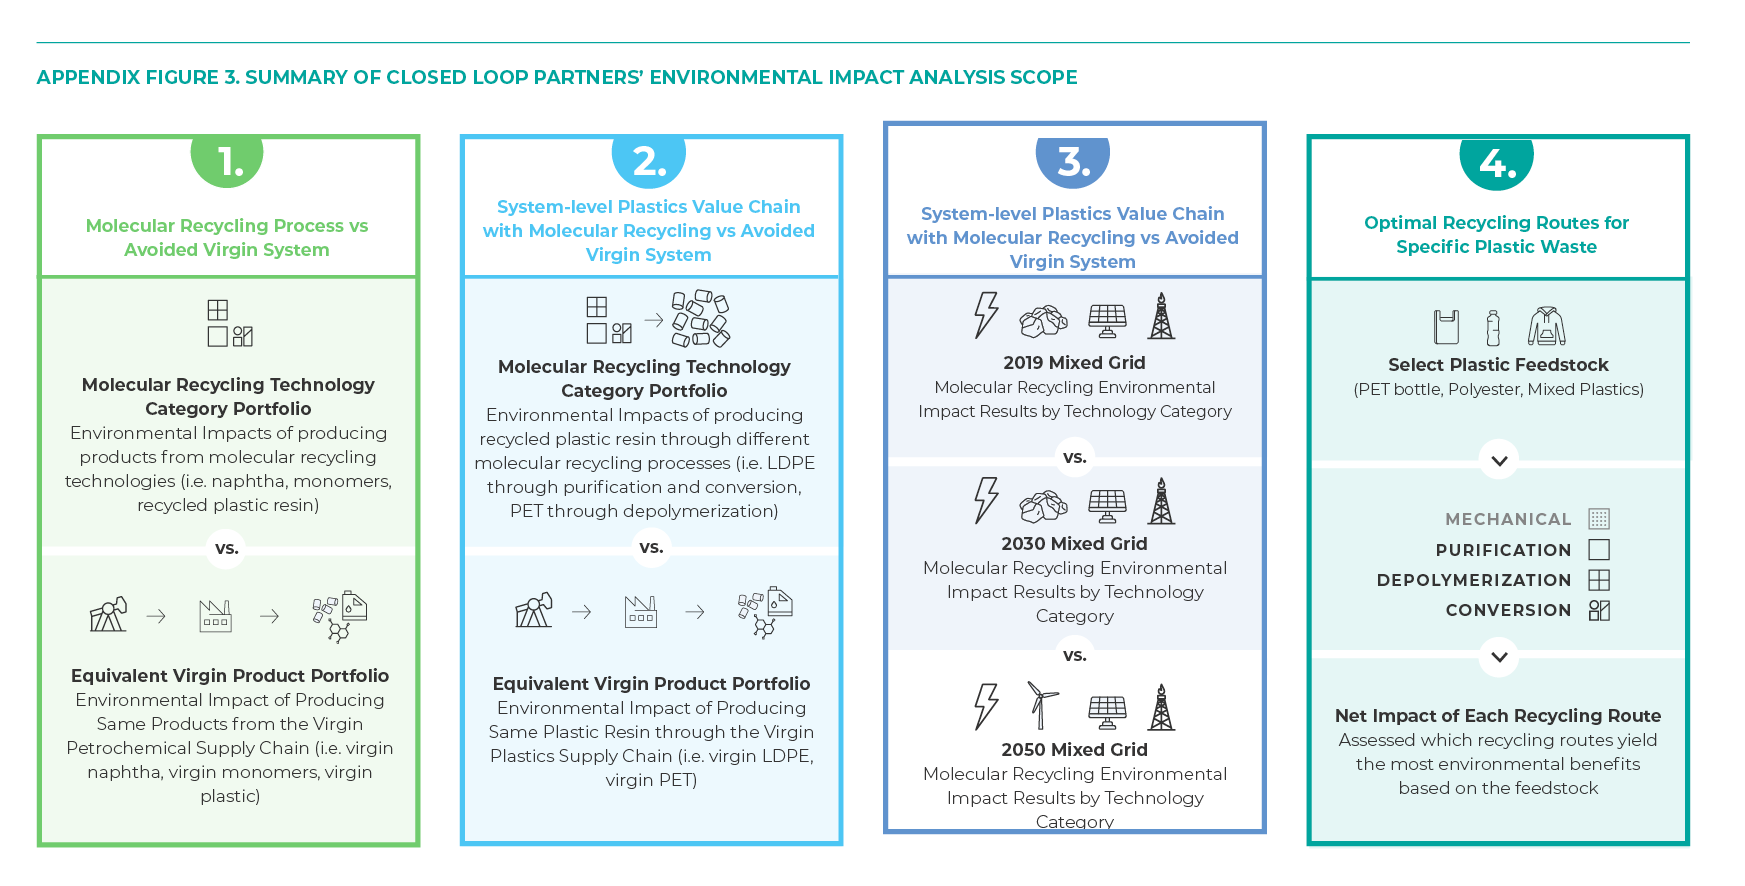
To answer these questions, a four-part research scope was designed which is summarized in Appendix Figure 3. Our teams felt it was particularly important to evaluate both the facility-level and the system-level impacts in order to gain insight to the benefits and trade-offs of producing specific outputs (i.e. monomers, naphtha)––and the benefits and risks of incorporating these technologies in a circular plastics economy. Pages 64-70 summarize our system-level analysis, while pages 129-130, 139-140, and 150-151 in the main report summarize our results at the facility-level.
We undertook part three of our environmental impact scope to understand what the future impacts of these processes could look like under projected energy scenarios in the United States and to understand the influence of renewable energy in this sector. The summary of these results are detailed on pages 66-73 and Figure 18 in the main report. Lastly, part four of our environmental impact analysis is summarized on pages 87-89 in the main report, and our findings have been incorporated into Figure 25.
Appendix Figure 3. Summary of Closed Loop Partners’ Environmental Impact Analysis Scope
Environmental Impact Analysis Methodology
Closed Loop Partners and its Center for the Circular Economy, partnered with Environmental Clarity and the Anthesis Group for the environmental impact analysis. Our teams started by comparing the impacts of producing specific outputs through advanced recycling systems compared to producing them through the virgin petrochemical industry. Next, we evaluated the impacts at the facility level, and finally we modelled the impact of bringing specific outputs from advanced recycling technologies back to a polymer. After collecting data from each company, our teams conducted multiple rounds of interviews to understand and validate our interpretation of each company’s raw data. We then modelled the life cycle assessments under the same set of assumptions which are outlined in full in Appendix 4.1
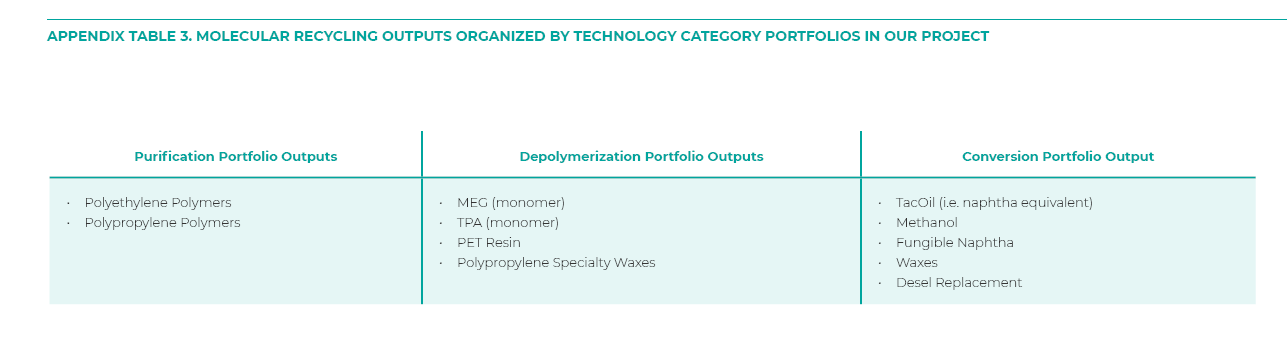
After creating individual facility life cycle assessments, we initially grouped the advanced recycling technology companies according to their technology category. Each technology category in our study became a “portfolio” that we studied to observe trends within the category and across the categories. Within each portfolio, there are multiple processes that produce different products (Appendix Table 3).
Appendix Table 3. Molecular Recycling Outputs organized by Technology Category Portfolios in Our Project
To understand the environmental impact and benefits of molecular recycling compared to virgin production of plastics and other products, our teams compared the environmental impact performance of over 10 distinct products produced across the 9 technology companies to the virgin equivalent (e.g. virgin monomer vs. monomer from molecular recycling processes). The four major key performance indicators which include total natural resource energy (NREt), climate impact potential (CO2e), bluewater––which come from Traci 2.1––and material processing yields (i.e. total mass of output or plastic). The difference, expressed as a percentage, between the recycled product and the virgin product is noted and the percentages with each portfolio are noted in Figures 27, 31, and 35 in the main report.
4.1: Lifecycle Assessment Methodology Submitted for Peer Review (Facility-Level Analysis Only)
Note: For the purpose of transparency and disclosure, Closed Loop Partners has not edited the lifecycle assessment (LCA) methodology that Environmental Clarity submitted for peer review in February 2021. In this document, the LCA team refers to molecular recycling technology as “Waste Plastic Recycling Technology” (WPRT). These terms are interchangeable.
Submitted by Michael Overcash and Evan Griffing, Environmental Clarity, Inc.
4.2: The Changing Electrical Grid from 2019 to 2050, United States
Projecting the effects of the evolving U.S. electrical energy grid deals with two factors:
– The generation total of the U.S. electrical grid is increasing
– The uses of individual technologies (like natural gas or wind) increase or decrease
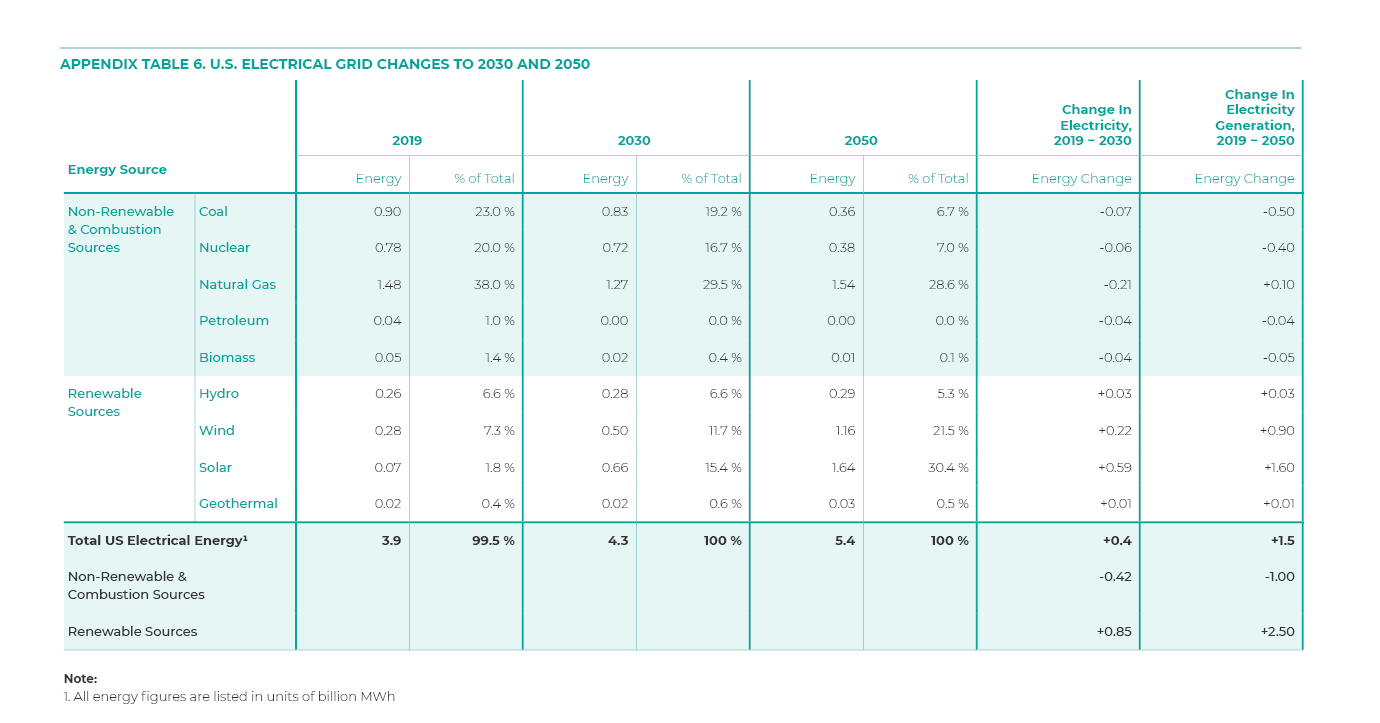
The U.S. Department of Energy has projected future uses of the various electricity generation technologies for 2030 and 2050 (NREL, 2020). The electricity generation changes for 2030 and 2050 by fuel are shown in real values as well as percentage changes from 2019 are provided in Appendix Table 6. We see the 2030 total grid increased by 0.4 billion MWh (a modest 10%) and we can see the different percentages of the total, but also the actual electricity delivered in MWh. The nonrenewable and combustion sources decreased, while the renewable sources increased to cover the nonrenewable decreases plus the increase in total grid demand. By 2050, the demand is up to 5.3 billion MWh and the nonrenewable technologies are continuing to decrease while renewables are picking up the increased demand. Solar is the largest increase followed by wind.
Appendix Table 6. U.S. Electrical Grid Changes to 2030 and 2050
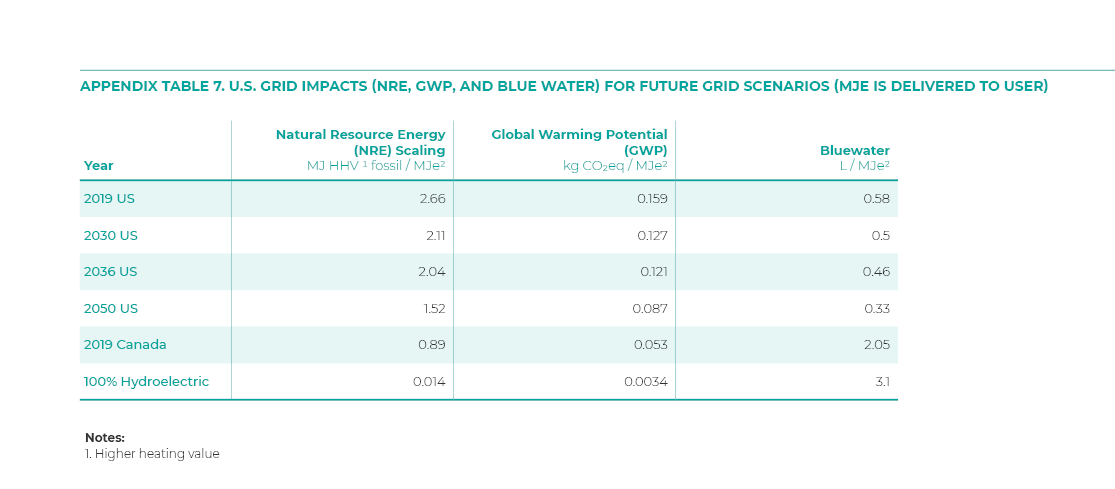
The impact on the KPIs for several grids is shown in Appendix Table 7. We can see the 2030 grid requires only 2.11 MJ fossil fuel/MJ electricity to the user (a 20% reduction from 2019), and there is a steady progression toward lower use of fossil fuels over time through 2050 getting to 1.52 MJ fossil fuel/MJ electricity (43% reduction). The carbon footprint in 2030 is 0.127 kg CO2eq/MJ electricity to the user, a 20% reduction from 2019. By 2050, the fossil resource and carbon intensity drop by 42% and 45%, respectively. The Canadian grid relies heavily on hydropower, which has a very low carbon footprint, but a high bluewater footprint, and the Canadian grid KPIs reflect this.
Appendix Table 7. U.S. Grid impacts (NRE, GWP, and Blue Water) for Future Grid Scenarios (MJe Is Delivered to User)
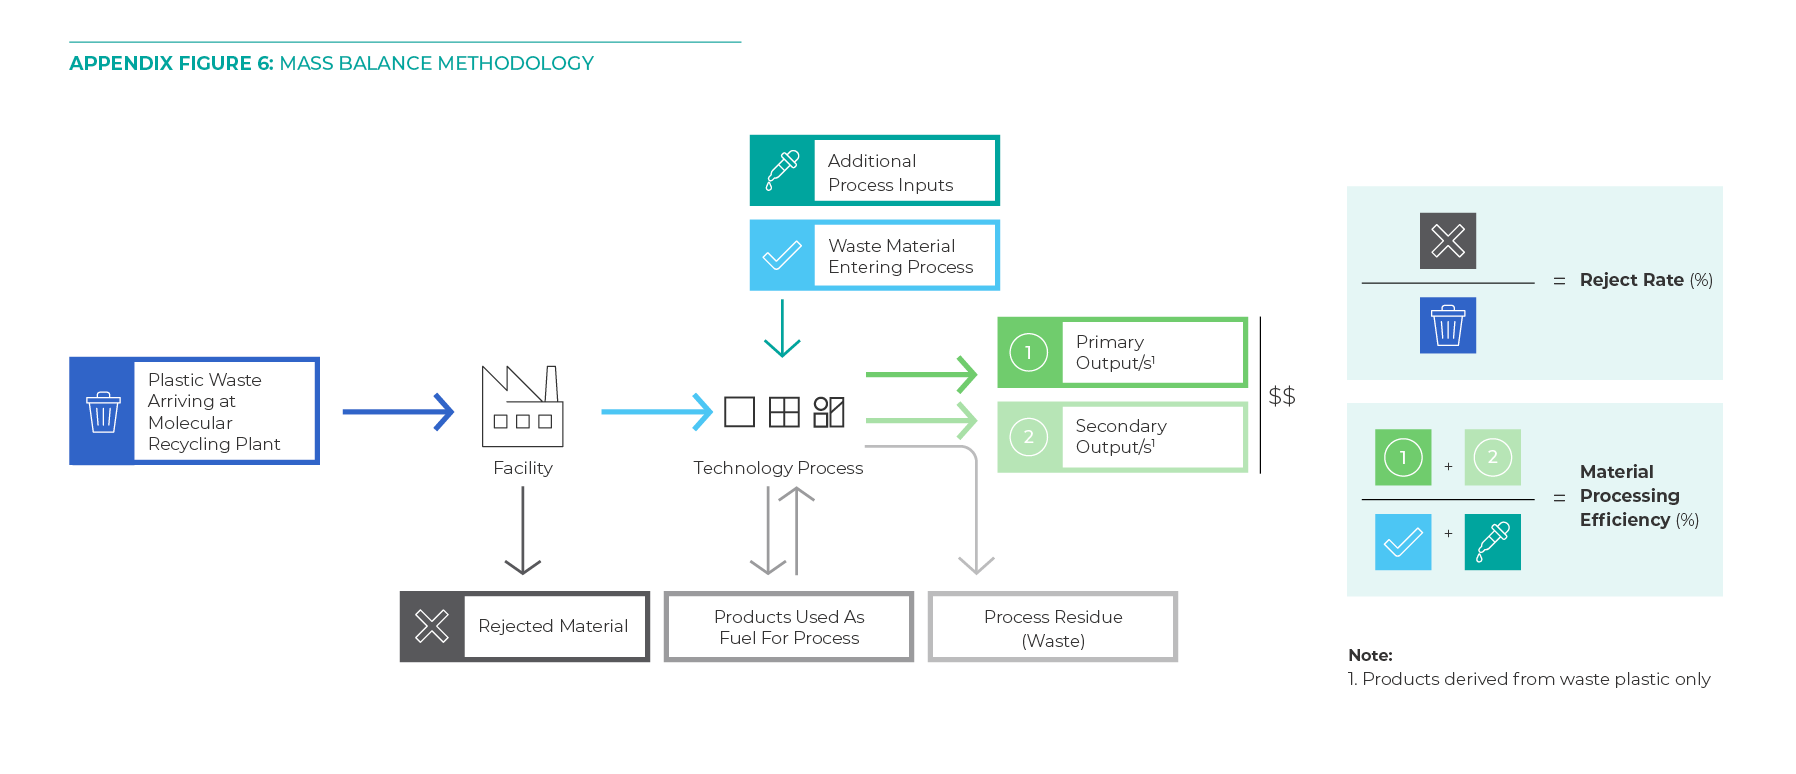
4.3: How to Calculate Mass Yield Percentages and Mass Yield Percentages
Appendix Figure 6. Mass Balance Methodology
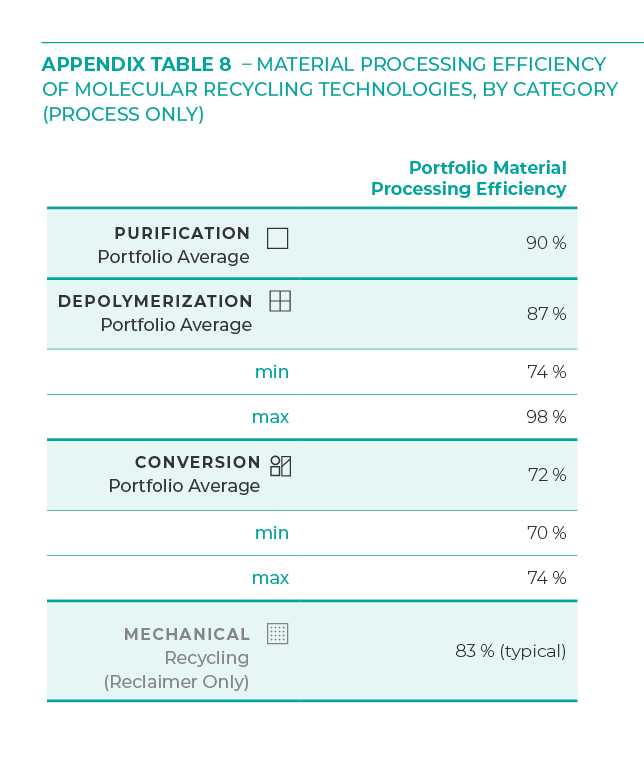
4.4: Mass Balance Results of Molecular Recycling Technology Processes in Study
Appendix Table 8. Material Processing Efficiency of Molecular Recycling Technologies, by Category (Process Only)
4.5: Explanation of Figure 24: Average Mass Yield When 1,000kg of Plastic Waste is Put into Each Technology Process
This figure represents comparison of technology categories on a mass balance basis with consistent system boundaries from waste input to product outputs. This demonstrates the potential mass loss at each of the processing stages with the consistent factor being the input of 1000kg of waste plastic & additives into the treatment technology. The aim of this figure is therefore to highlight efficiency of each process at transforming waste into outputs, and the requirement of additional additive inputs to the process.
For the purposes of this graphic:
– Conversion to pellet output has been explored despite not all technology companies reviewed not currently delivering this
– One technology has been excluded from depolymerization due to its significantly different input feedstock (of pellet rather than waste plastic)
This is placed on plastic waste only and for conversion technologies does not include mass loss associated with receiving mixed wastes.
5.0: Human Health Impact Analysis
Research Scope
Measuring human health effects of molecular recycling technology presents considerable challenges. Lifecycle Analysis (LCA) places a disproportionate emphasis on impacts from energy production and use. The most commonly used LCA methodology, TRACI 2.1, has human health impact factors for both energy and direct process related emissions. The LCA and technical experts, which included Environmental Clarity, Scivera, and Anthesis Group attempted to obtain information about direct emissions from each of the ten technology processes evaluated, in order to estimate impacts to human health using Traci 2.0 PM 2.5, Cancer and Non-cancer impact categories. The team was able to use this approach to estimate impacts from indirect emissions from the energy used by the molecular recycling technologies, but could not obtain detailed data sets for other direct emissions of chemicals or compounds to air, water or solid waste (i.e., identifying specific chemicals, their amounts and end-of-life handling).
Using TRACI 2.1 methodology, our teams found that energy-related emissions accounted for over 90% of the total human health impacts found through the life cycle analysis of the nine molecular recycling companies. Direct emissions from manufacturing processes make up the remainder. Due to the complexity of measuring human health effects, it is a generally accepted LCA-principle that the differences between two comparatives — in this case recycled and virgin products — must be greater than a factor of 100-fold (10,000%) for them to be considered significant. Under this principle, our study did not produce statistically significant differences between these molecular recycling technologies and their virgin equivalents on the basis of energy-related emissions alone.
In addition to the analysis using TRACI 2.1, the research teams conducted a supplemental review of the potential impacts to human health from direct emissions from molecular recycling technologies. This review included a selective literature review and a qualitative assessment of the hazards associated with virgin production of polymers. For the purposes of this review, molecular recycling processes are divided into two broad categories of chemical recycling (as opposed to mechanical and biological): solvent-based, represented by purification and decomposition processes, and secondly, thermal-chemical, represented by conversion processes.
5.1: Methodology for Estimating the Chemical Footprint of Polymers
Our teams used two resources to perform a qualitative assessment of five polymers. We collaborated with Scivera, a company that has developed a software as service platform called SciveraLENS to assess all of the primary, intermediate and monomer chemicals used to make PET, PE, PP and PS homopolymers. The other source of information comes from the Environmental Genome, a database of 1,500+ chemical profiles that quantifies the chemical inputs, process conditions of flow, temperature, pressure, and chemical composition of all streams, from which the energy use is determined along with the mass balance to indicate emissions.
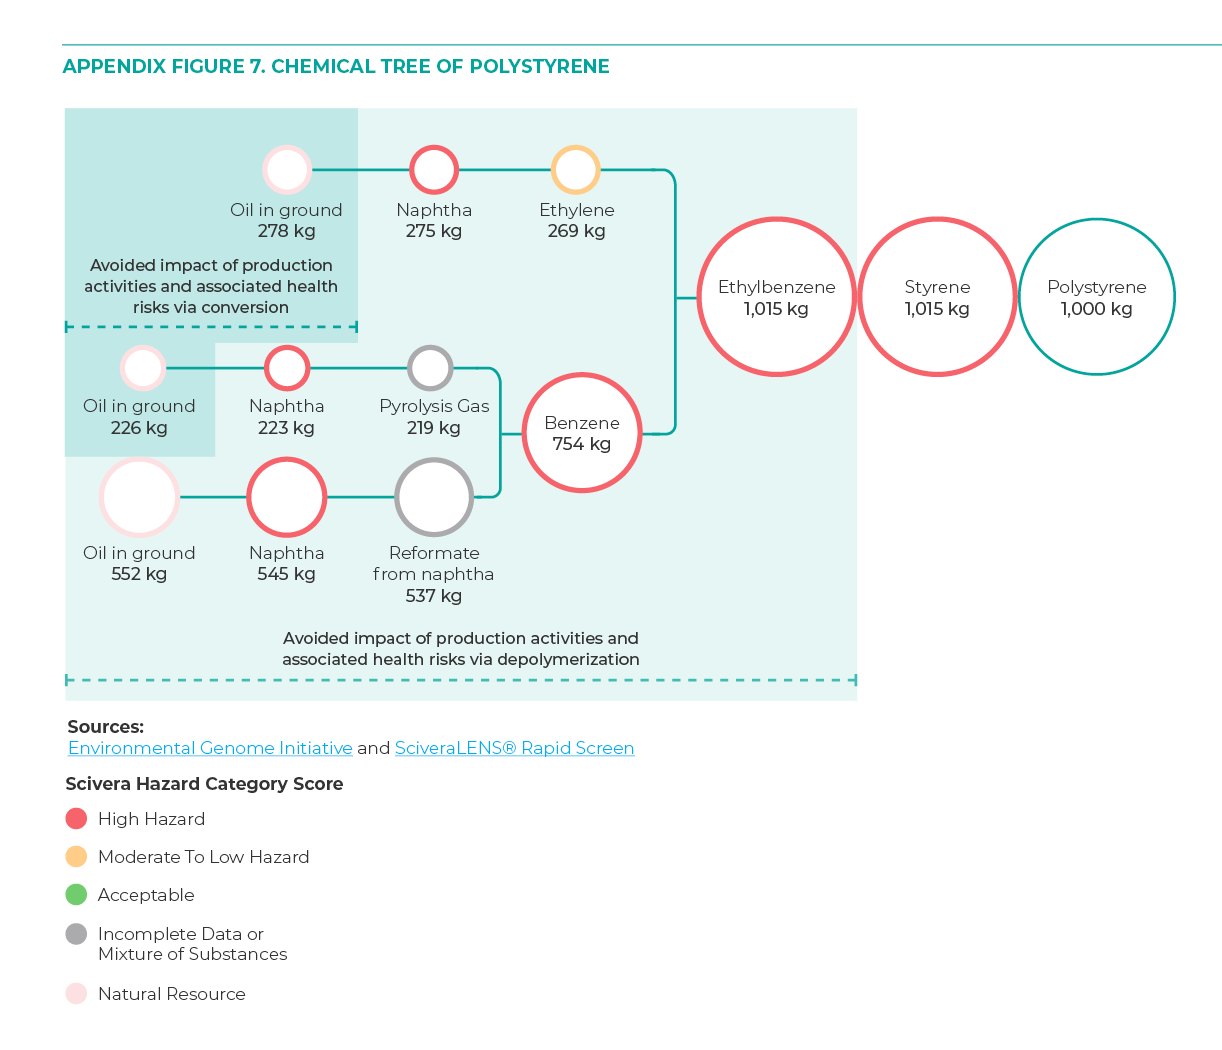
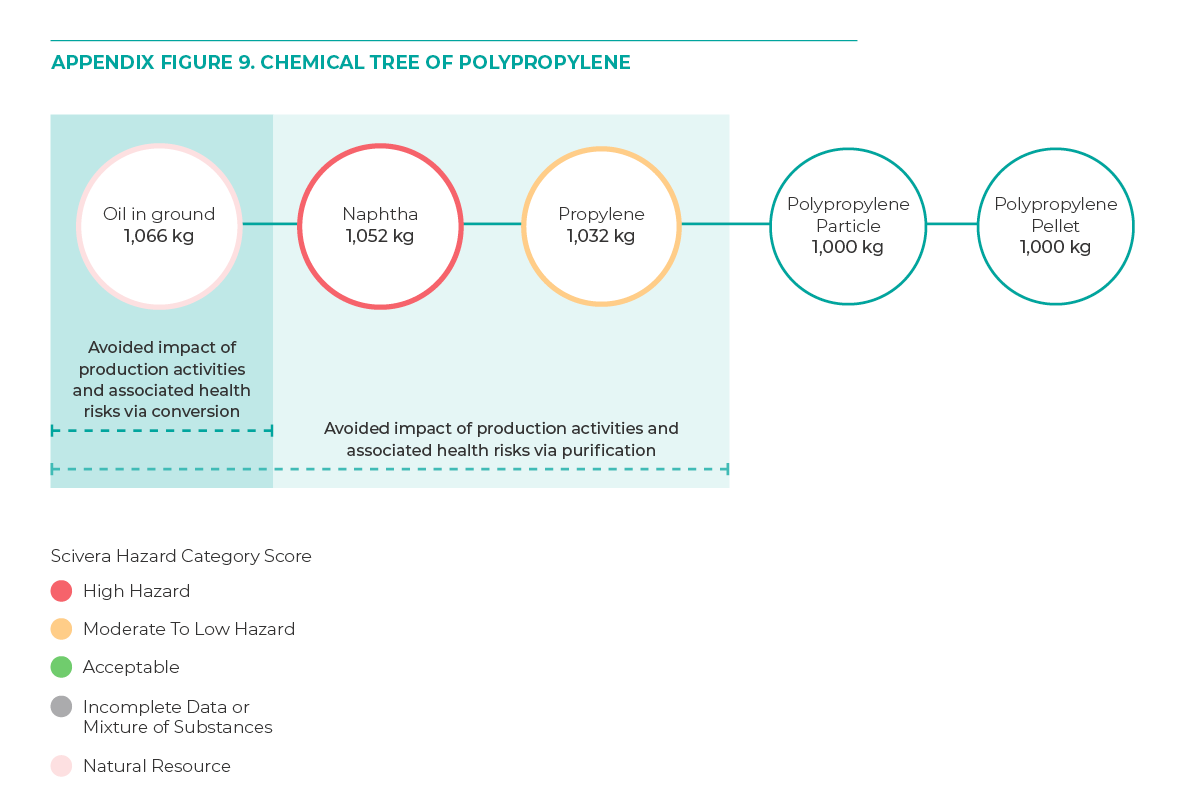
These separate profiles are combined to give an overall chemical and energy assessment from natural resources in the earth to the final chemical product, including allocation of all byproducts which are illustrated in Figure 21 and FIgure 22 in the main report and in Appendix Figure X, Y, Z below. These chemical trees show how the four homopolymers are “built up” from the oil and/or gas (“cradle”) to finished pellet (“gate”). For a more detailed explanation of the SciveraLENS hazard assessment methodology used to calculate the hazard category ratings, see Scivera’s GHS+ Chemical Hazard Assessment Framework. The Environmental Genome database contains more information about its methodology for creating chemical and polymer profiles.
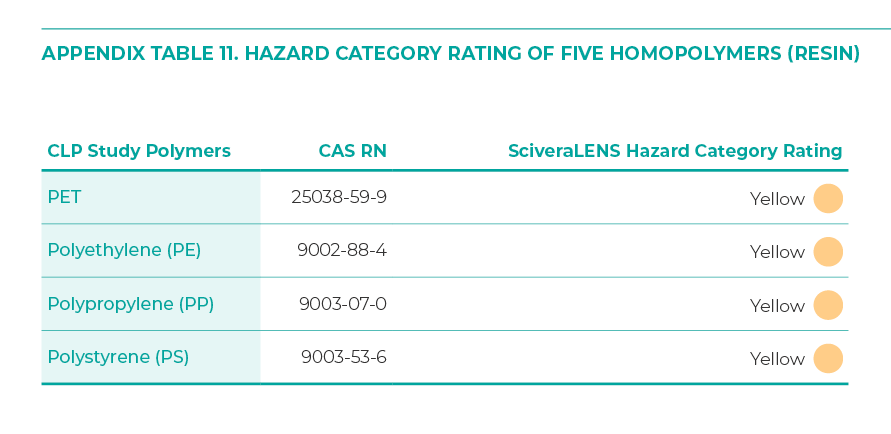
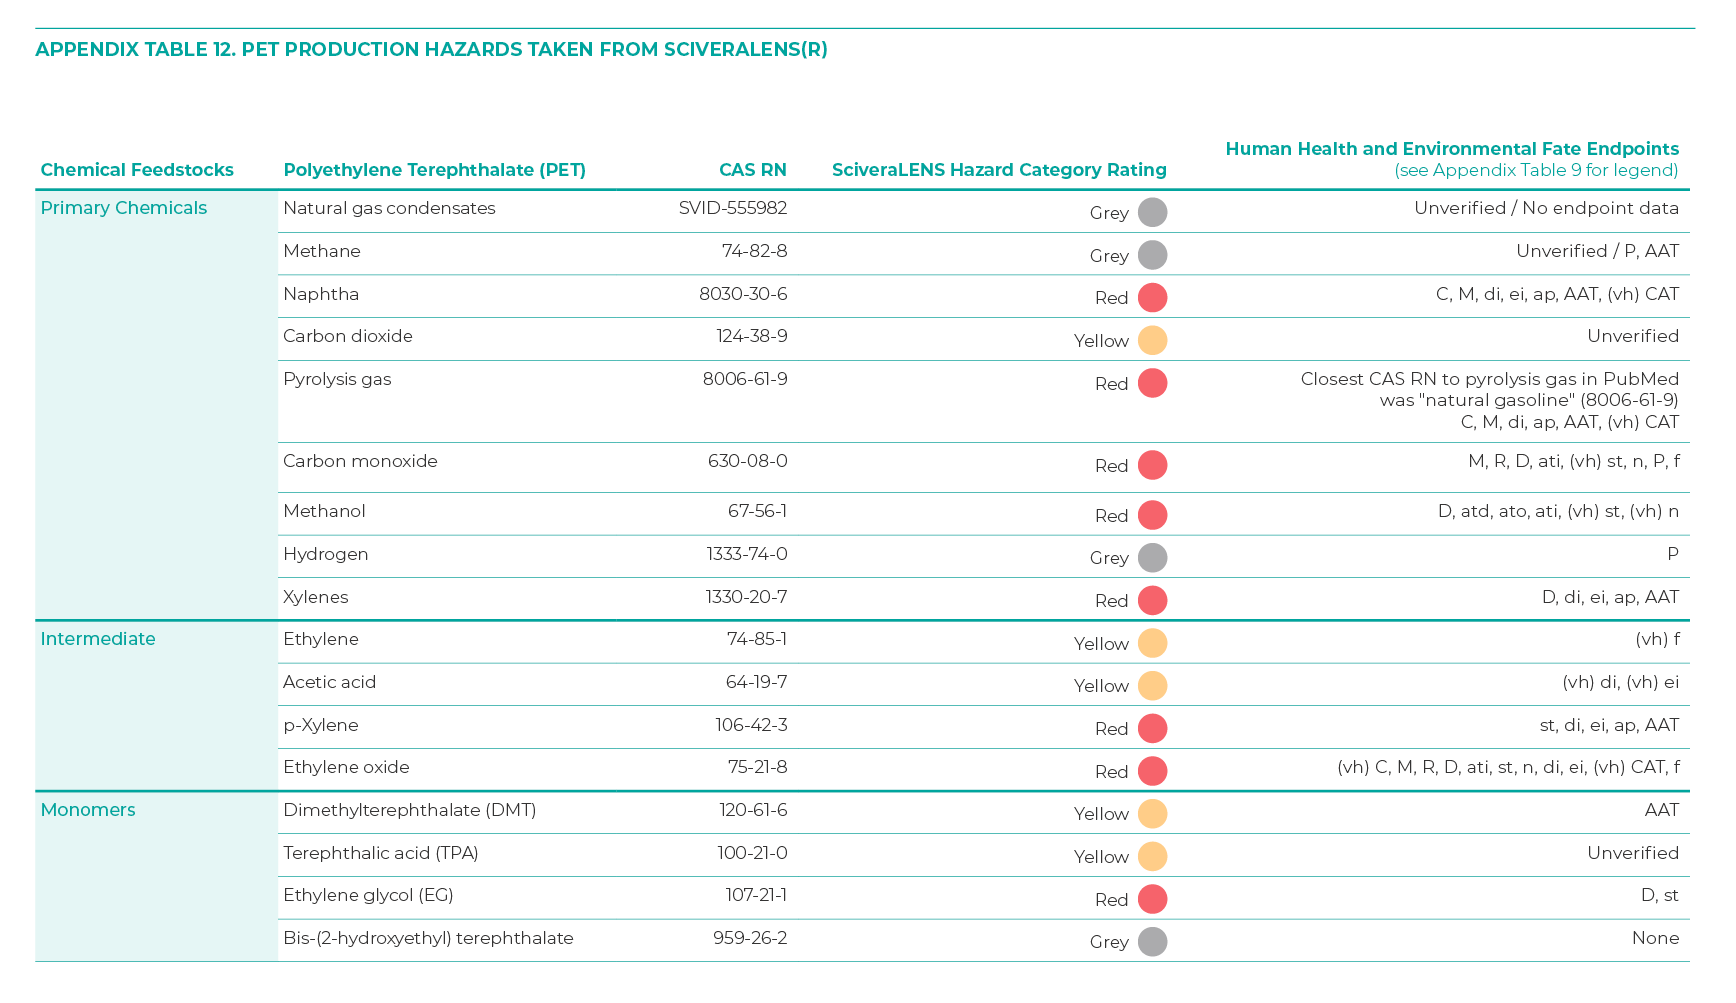
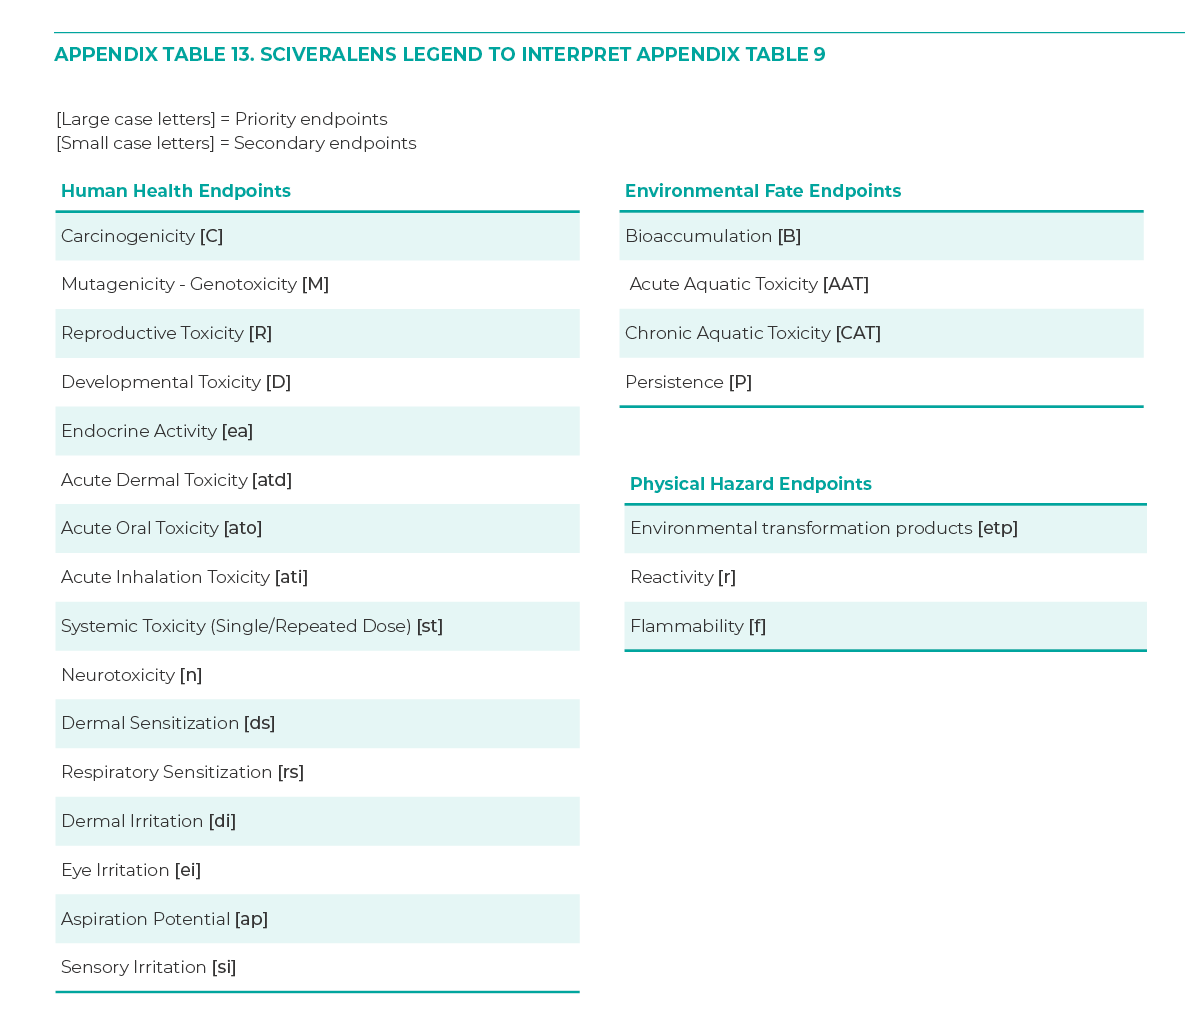
The SciveraLENS tables include the most common chemical abstract service registry number (CAS RN), and Scivera’s hazard category rating, and a summary of the estimated impacts to human health and environmental fate endpoints for each chemical. As indicated in these summary tables, unlike homopolymers (i.e, PET, polypropylene, polystyrene, etc.), many precursor chemicals are considered to be hazardous. The chemical trees from the Environmental Genome database help to visualize the chemical footprint for each polymer, indicating where each chemical is used as well as the amount it contributes to each ton of polymer resin produced. The hazard category ratings from SciveraLENS have been overlaid onto the chemical trees to make it easier to visualize the potential impacts to humans or the environment at each stage of a polymer’s cradle to gate footprint.
Appendix Table 11. Hazard Category Rating of Five Homopolymers (Resin)
Appendix Figure 7. Chemical Tree of Polystyrene
Appendix Figure 8. Chemical Tree of HDPE
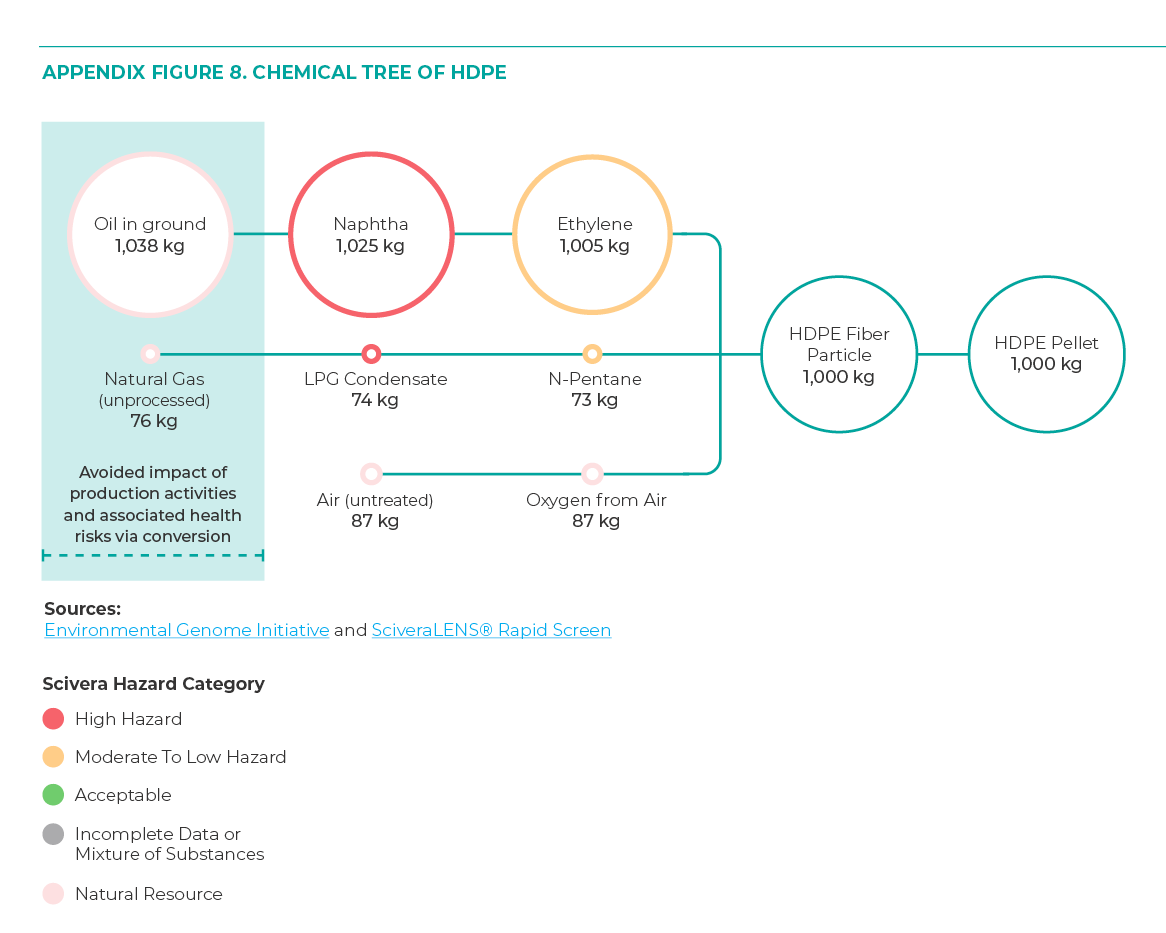
Figure 9. Chemical Tree of Polypropylene
5.2: Calculating Chemical Footprints of Molecular Recycling Technologies
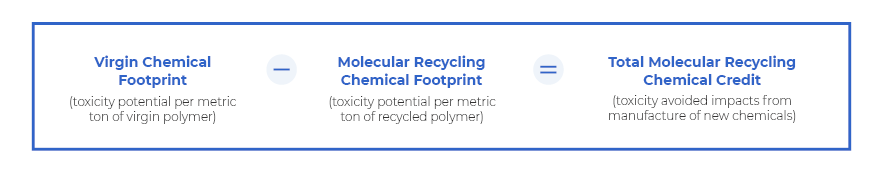
Ideally, it would also be possible to use a “chemical footprint” metric (e.g., chemical toxicity potential per Kg of homopolymer) to assign credits for avoided impacts from manufacturing chemicals to make virgin resins for every ton of recycled plastic. Such a calculation would not need to include the avoided impacts from the manufacture and use of chemical additives because these will be used to make compounded plastics regardless of whether the homopolymer comes from virgin or recycled feedstock. The avoidance credits assigned to each homopolymer would be based on its “chemical toxicity/Kg” value which is calculated as the total percentage by weight of all chemical inputs with a high (Red) hazard rating. Looking at the chemical trees above and in the report, the hazards ratings for each chemical input, a ton of recycled PET or PS has a greater benefit in terms of avoided chemical impacts than a ton of polyolefin resins.
The calculation could be further refined to account for the fact that not all Red rated chemicals are equal in terms of their hazards. For example, in the manufacture of PET, p-Xylene is assessed as high hazard due to systemic toxicity, dermal and eye irritation, aspiration potential and acute aquatic toxicity, while ethylene oxide has the same rating because it is assessed as very high hazard for carcinogen, mutagen, reproductive and developmental toxicity and high hazard for acute inhalation, systemic toxicity, neurotoxicity, dermal and eye irritation, very high chronic aquatic toxicity, and flammability. Tables 9 and 10 interpret the Human Health and Environmental Fate Endpoints). Such differences should be factored into the final chemical toxicity score. SciveraLENS has developed a decimal index from 0.1-1.0 (i.e., 0-100) that allows users to measure the gradations in between hazard category ratings so one knows if a yellow is much closer to being a red than it is a green for example.
Appendix Table 12. PET Production Hazards taken from SciveraLENS
Appendix Table 13. SciveraLENS Legend to interpret Appendix Table 9
Then, to measure the total credit for each output from a molecular recycling technology, evaluators would need to subtract the toxicity potential of the chemicals required to build molecular recycling outputs back up to homopolymers.
An equation might look like:
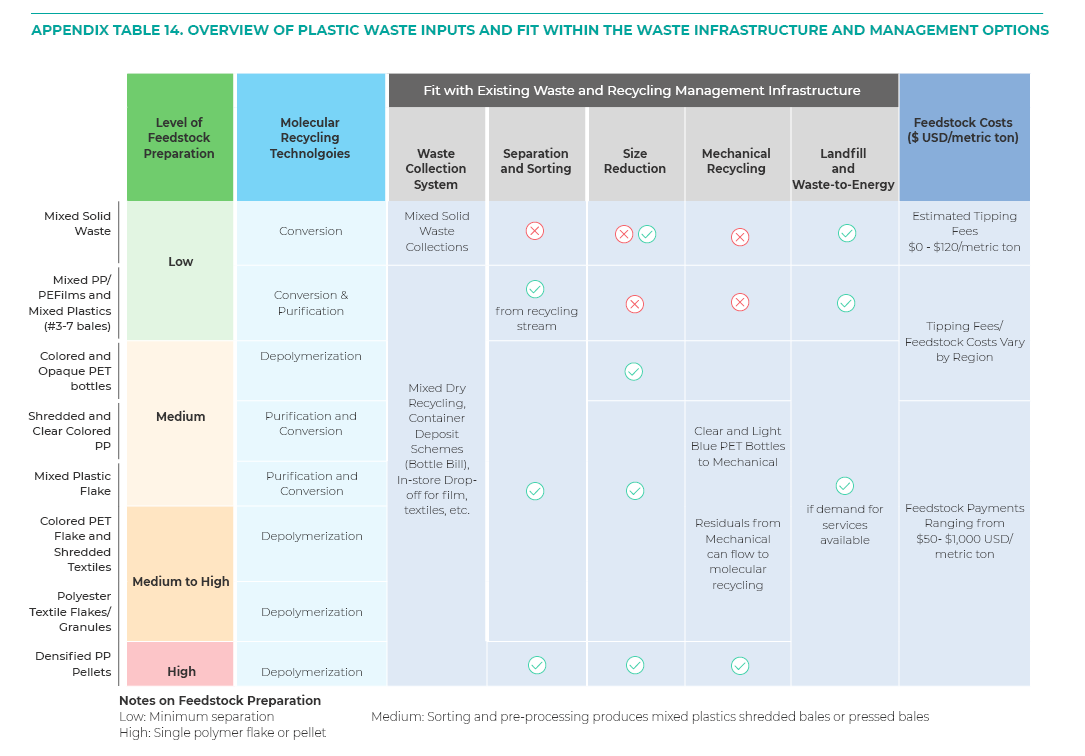
6.0: Feedstock for Molecular Recycling
In general, purification and depolymerization technologies require single-resin feedstock while conversion technologies have the most flexible feedstock requirements. Appendix Table 14 matches plastic waste, technology types, existing waste infrastructure, and estimated costs.
Appendix Table 14. Overview of Plastic Waste Inputs and Fit Within the Waste Infrastructure and Management Options